

Foreign trade relations
In January - October 2024 legal and natural entities of the Republic of Azerbaijan realized trade operations with their partners in 172 countries of the world, goods were exported to 120 countries and imported from 162 countries.
Taking into account value of statistically estimated exported crude oil and natural gas registered in the customs agencies but customs formalities of which not completed the foreign trade turnover of the country in January - October 2024 made 38412,7 million USD. 21776,3 million USD or 56,7% of trade turnover made the export value, 16636,4 million USD (43,3%) – import value and consequently positive trade balance reached to 5139,9 million USD. In comparison with January - October 2023, foreign trade turnover amounted to 100.0% in actual prices, while in real terms decreased by 3.9%, including import by 0.4% and export by 5.9%.
In January - October 2024 the export of non-oil gas products made 2807,5 million USD, and compared to January - October 2023, increased by 3,5% in actual prices while in real terms it decreased by 9,1%.
According to the State Customs Committee data, 24,3% of foreign trade turnover of the country was per the share of trade operations with Italy, 13,1% – Türkiye, 10,0% – Russia, 7,7% – China, 3,3% – Germany, per 2,6% - USA and Australia, 2,4% - Czech Republic, 2,3% – India, 2,2% - Croatia, 1,9% - Israel, 1,7% - Georgia, per 1,6% - Portugal and United Kingdom, 1,5% - Bulgaria, per 1,3% - Iran and Greece, 1,1% - Romania, per 1,0% – Belarus, Kazakhstan, Switzerland and Ukraine, per 0,9% - Japan and Turkmenistan, and 11,7% – other countries.
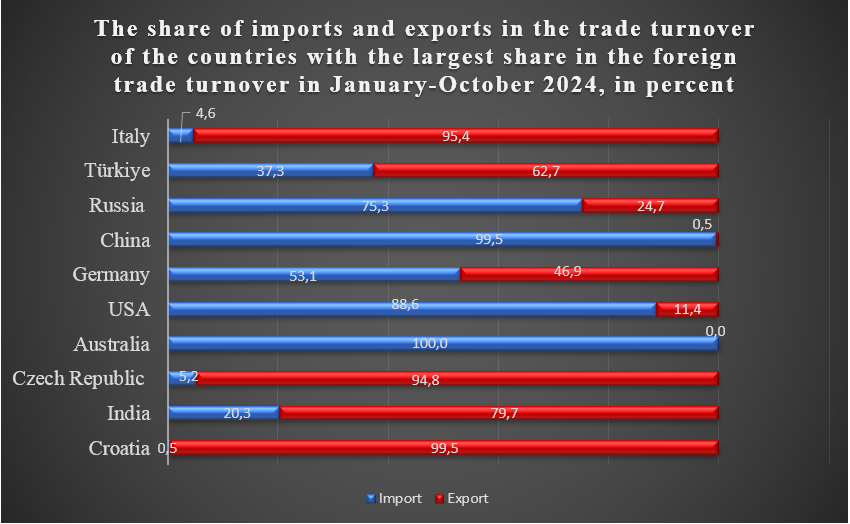
40,1% of the total value of exported goods was per the share of Italy, 14,2% - Türkiye, 4,3% - Russia, 4,0% - Czech Republic, 3,7% - Croatia, per 3,2% - India and Israel, 2,8% - Portugal, 2,7% - Germany, 2,5% - Georgia, 2,4% - Bulgaria, 2,1% - Greece, 1,8% - United Kingdom, 1,7% - Romania, 1,2% - Tunis, 1,0% - Thailand, per 0,7% - Switzerland, Serbia, Spain and Indonesia, per 0,6% - Ukraine and the Netherlands, 5,1% - other countries.
The share of goods shipped to Russia (34,1%), Türkiye (17,0%), Georgia (8,3%), Switzerland (6,0%), USA (4,2%), Kazakhstan (3,8%), Ukraine (3,2%), Turkmenistan (2,5%), Oman (2,3%), United Arab Emirates (1,6%), Germany (1,5%), Belarus (1,4%), the Netherlands (1,2%), Italy (1,2%), Romania (1,1%), Uzbekistan (1,1%), prevailed in export value on non–oil gas products.
18,0% of total value of goods imported to the country was per the share of China, 17,9% - Russia, 11,5% - Türkiye, 6,2% – Australia, 5,5% – USA, 4,1% – Germany, 3,1% - Iran, 2,7% – Italy, 2,2% - Belarus, 2,1% - Japan, 2,0% – Korea, 1,7% – Kazakhstan, 1,6% – Turkmenistan, per 1,4% - Ukraine and Switzerland, 1,3% – United Kingdom, 1,2% - France, 1,1% - India, per 1,0% – Uzbekistan and Canada, 0,9% - Brazil, 0,8% - Spain, 11,3% – other countries.
In January - October 2024 compared to the corresponding period of previous year export of main types of products like fresh fruit increased by 0,5%, fresh vegetable – 2,4%, sugar – 62,9%, tobacco – 3,5 times, fruit and vegetable cans – 13,4%, vegetable oils – 61,7%, margarine and other mixtures fit for food – 68,9%, tea – 6,2%, cotton fiber – 98,1%, mineral fertilizers – 76,3%, cotton yarn – 4,6%, bentonite clay – 28,9% while export of potato decreased by 32,0%, fruit and vegetable juice – 2,1%, natural grape wines and grape juice – 42,3%, polypropylene – 21,4%, polyethylene – 17,0%, electrical energy – 49,2%, unprocessed aluminum – 16,8%, cement clinkers – 1,2%, ferrous metal rods – 0,7%, ferrous metal pipes – 8,6%.
In January - October 2024 compared to January - October 2023 import of vegetable oils increased by 15,1%, butter, other milk fats and pastas – 85,3%, fresh fruit – 25,8%, flour confectionery – 12,3%, chocolate and chocolate products – 14,5%, tea – 9,2%, poultry meat and its additional products – 38,3%, beef – 56,5%, fresh vegetable – 59,7%, computing machinery, blocks and installations – 25,1%, trucks – 22,3%, furniture – 44,3%, synthetic detergents – 7,1%, household air conditioners – 42,7%, ferrous metal rods – 57,9%, mineral fertilizers – 17,5%, washing machines – 3,5%, buses – 3,2 times, polypropylene – 22,8%, cement – 7,2%, while import of raw sugar decreased by 2,0%, potato –21,7%, cigarettes – 71,7%, cars – 10,8%, medical products – 26,5%, rolled steel – 9,0%, ferrous metal pipes – 7,5%, rubber tires – 8,1%, polyethylene – 8,3%, ferrous metal corners – 7,5%, domestic refrigerators – 7,0%.
Tel: 377 10 70 (22-60)


